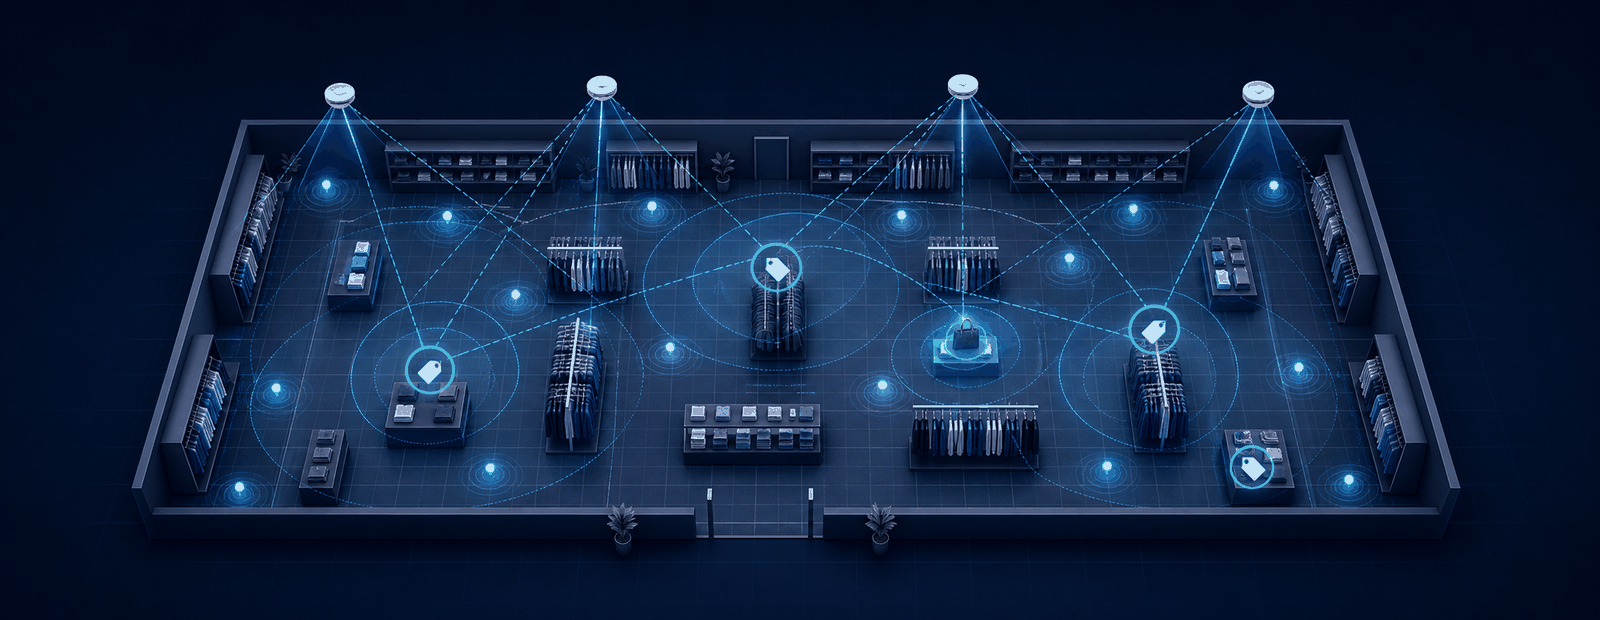
Barcodes and paper tags tell you what a product is. They do not tell you where it is right now, or what shoppers do with it before it reaches the till. That gap is what indoor positioning closes. As electronic shelf labels, RFID and low-power radios spread across retail, the store floor is becoming a live coordinate space - and choosing the right positioning technology has become a real engineering decision, not a buzzword.
This guide is written for solution providers and system integrators who have to specify, price and defend a positioning stack. It explains each technology in plain terms, compares them on accuracy, cost and scalability, then goes deep on two questions apparel retailers keep asking: how do we measure pick-up rate, and how do we hit high inventory accuracy. It closes with a transparent ROI model and a selection checklist. No vendor names, no marketing - just the physics, the numbers and the trade-offs.
What Is Retail Indoor Positioning?
What does "indoor positioning" actually mean in a store?
Indoor positioning is any system that estimates the physical location of a tagged object or device inside a building, where GPS is too weak or too coarse to work. When those location estimates are continuous and live, the system is usually called a real-time locating system (RTLS). In retail the "thing" being located can be a product, a shelf label, a shopping trolley, a handheld, a staff badge or a shopper's phone.
Every positioning system has the same three parts: a tag or transmitter on the object, one or more fixed anchors, readers or gateways on the ceiling or shelving, and a location engine - software that turns raw radio measurements into coordinates on a store map. What changes between technologies is the physical measurement the radios make: signal strength, angle, or time of flight.
Locating vs identifying: why an RFID scan is not a location
This is the most common source of confusion in retail projects, so it is worth being precise. Identification tells you an item exists and was seen; positioning tells you where it is. A passive RFID read at a doorway or from a handheld confirms "this SKU passed this reader" - it is a presence event inside a zone, not an x/y coordinate. A true RTLS (Bluetooth AoA, UWB) computes coordinates continuously, so you can draw the item as a moving dot on a floor plan.
Both are valuable, and they answer different questions. If your question is "how many of this SKU are in the building and are they on the floor or in the back room," zone-level identification is often enough. If your question is "which rack is this jacket on, and how many times was it lifted this afternoon," you need real coordinates. Many mature deployments run both layers together.
How accurate does retail positioning need to be?
Accuracy requirements come in tiers, and over-buying accuracy wastes money. Store-wide analytics and heatmaps tolerate metre-level error. Aisle- or bay-level tasks want sub-2-metre. Telling apart two adjacent racks, or binding a shelf label to the exact product beneath it, needs sub-30-centimetre. The table below maps the practical tiers to the retail jobs they unlock.
| Accuracy tier | Typical error | What it can do in retail | Technologies that reach it |
|---|---|---|---|
| Zone / presence | Room or read-zone | Stock in building, in/out of back room, doorway loss prevention, cycle-count. | Passive RFID, EAS. |
| Room / coarse | 5–15 m | Store-level footfall, dwell heatmaps, coarse wayfinding. | Wi-Fi (RSSI), cellular. |
| Aisle / bay | 1–5 m | Which aisle a shopper is in, zone dwell, proximity offers. | BLE beacons (RSSI). |
| Sub-metre | 0.3–1 m | Fixture-level analytics, staff safety, near-rack context. | Bluetooth AoA, Wi-Fi RTT. |
| Centimetre | 0.1–0.3 m | Tell apart adjacent racks, tag-to-product binding, pick/put-back events, robotics. | Bluetooth AoA, UWB. |
Accuracy ranges are indicative industry figures; real results depend on anchor density, calibration and store RF conditions. Sources cited in the technology sections below.
Why Retail Actually Needs Location Data
What problems does shelf-and-floor location solve?
Location data pays for itself when it removes manual searching, prevents lost sales, or reveals shopper behaviour that sales receipts cannot. Retailers do not buy positioning for its own sake - they buy an outcome. When we group the outcomes integrators are actually asked to deliver, five recurring use cases dominate, each with a different value driver and a different accuracy floor.
| Use case | Value driver | Accuracy needed | Best-fit technology |
|---|---|---|---|
| Inventory count & stock accuracy | Fewer stockouts, less shrink, faster counts | Zone / presence | Passive RFID |
| Pick / replenishment navigation | Staff labour saved, faster restock | Sub-metre | AoA / UWB |
| Product interaction (pick-up rate) | Merchandising insight, conversion uplift | Centimetre (fixture level) | AoA / UWB (+RFID) |
| Tag-to-product binding & anti-error | Price/label integrity, compliance | Centimetre | AoA / UWB |
| Shopper flow & heatmaps | Layout, staffing, retail media | Aisle / room | BLE / Wi-Fi |
Which use case delivers the most value? A quick customer-research read
Ask ten retailers to rank these five, and inventory accuracy is almost always first - because inaccurate stock quietly destroys margin at both ends: lost sales from phantom stockouts and markdowns from over-buying. The Auburn University RFID Lab has measured this for years in apparel: item-level RFID lifts inventory accuracy from roughly 63% to 95% or higher, cuts out-of-stocks by up to 50%, and shrinks a physical count from about eight days a year to half a day. That is a hard, repeatable number - which is why RFID adoption in apparel is now mainstream.
The second-ranked need is more interesting because it is newer and under-served: product-interaction analytics, often summarised in apparel as "pick-up rate." E-commerce measures every hover, click and add-to-cart. The physical store, historically, only measured the final purchase. Positioning changes that. If you can detect that a garment was lifted off the rail, carried, tried on and put back, you can finally see the physical equivalent of a product page's engagement funnel - and merchandise to it.
The Positioning Technologies Explained
Six technology families cover almost every retail deployment. Here is how each one measures location, what accuracy it realistically delivers, and where it breaks down.
Bluetooth AoA (Angle of Arrival) - how does it work?
Bluetooth AoA locates a tag by measuring the angle its signal arrives at a multi-antenna anchor, then triangulating from several anchors. A small battery tag transmits an ordinary Bluetooth Low Energy direction-finding signal; the ceiling anchor has an antenna array and reads the phase difference across its antennas to compute a bearing. Two or more bearings intersect at the tag. Because AoA rides on standard BLE (introduced in Bluetooth 5.1 Direction Finding), tags are cheap, low-power and long-lived.
Accuracy: roughly 10-50 cm with good anchor density and calibration, according to the Bluetooth SIG. Strengths: centimetre-class accuracy at BLE tag cost and battery life; scales to thousands of tags; the tag is the cheap part. Limits: intelligence and cost sit in the anchors; needs careful array calibration; reflective metal environments degrade angle estimates.
Ultra-wideband (UWB) - how does it work?
UWB measures the time of flight of very short radio pulses across a wide frequency band, converting travel time directly into distance. Multiple anchors each measure their distance to a tag, and the location engine trilaterates. Because it uses time rather than signal strength, UWB is far more robust to reflections than RSSI methods, and its wide bandwidth gives fine time resolution - hence centimetre accuracy. The technology is standardised under IEEE 802.15.4z and certified by the FiRa Consortium.
Accuracy: typically 10-30 cm in industrial RTLS, with sub-0.2 m ranging error even in many non-line-of-sight cases, and lab results down to a few centimetres. Strengths: the gold standard for precision and multipath resistance; secure ranging; now built into flagship phones. Limits: tags cost more and draw more power than BLE; anchors and tags are pricier; battery life is shorter, which matters for item-level tagging at scale.
BLE beacons (RSSI) - how does it work?
Classic BLE beacon positioning estimates distance from received signal strength (RSSI): the weaker the signal, the further away the tag is assumed to be. A phone or fixed scanner hears several beacons and infers a rough position, or simply the nearest beacon (proximity). It is the cheapest, most mature approach and needs no antenna arrays - but signal strength is a noisy proxy for distance.
Accuracy: metre-level in practice, commonly 1-5 m and degrading in crowded, three-dimensional stores, per a peer-reviewed BLE RSSI study. Strengths: lowest cost, huge device support, great for proximity offers and aisle-level context. Limits: not accurate enough to separate adjacent fixtures or bind a label to a product; RSSI drifts with human bodies, shelving and interference.
Wi-Fi (RSSI and RTT) - how does it work?
Wi-Fi positioning reuses the access points a store already has, either by signal strength (RSSI) or, in newer hardware, round-trip time (RTT / 802.11mc FTM). RSSI gives coarse, room-level location; RTT measures time of flight like a lightweight UWB and can reach 1-2 m under good conditions. Its big advantage is infrastructure reuse; its limits are inconsistent client support and accuracy that still trails the high-precision routes.
Accuracy: 5-15 m for RSSI, roughly 1-2 m for RTT with compatible devices. Strengths: uses existing APs, no tag on the shopper beyond their phone, good for footfall analytics. Limits: device dependency, coarse for merchandising, not suitable for item-level work.
Passive RFID (UHF) - how does it work?
Passive UHF RFID puts a batteryless tag on every item; a reader powers the tag with radio energy and reads its unique ID as it passes within range. It is not a coordinate system - it is high-speed identification within a zone (a doorway, an overhead reader, a handheld sweep, a smart fixture). That is exactly what full-store inventory needs: read hundreds of tags per second, reconcile against the system of record, and know your true stock. Benchmarks come from the Auburn University RFID Lab and Avery Dennison.
Accuracy: zone / presence, not x/y (fixed infrastructure can narrow this to a bay). Strengths: tags cost only cents, no battery, unbeatable for fast item-level counts and apparel inventory. Limits: gives presence not live coordinates; metal and liquids detune tags; continuous real-time location needs dense fixed readers, which gets expensive.
Geomagnetic and visual (VPS) - how do they work?
Geomagnetic positioning fingerprints a building's magnetic distortions; visual positioning (VPS) matches a phone camera view to a 3D map. Both are "infrastructure-light" - no anchors to hang - but both need up-front mapping and shopper app cooperation, and neither tags the merchandise. They suit shopper wayfinding more than stock or merchandising analytics.
Accuracy: roughly 1-3 m (geomagnetic), sub-metre in good light (VPS). Strengths: little fixed hardware, good for app navigation. Limits: mapping and maintenance overhead, phone-dependent, cannot locate untagged items or unengaged shoppers.
Indoor Positioning Technologies Compared
Which technology wins on accuracy, cost and scale?
There is no single winner - each technology sits at a different point on the accuracy-versus-cost curve, and the right pick depends on the job. The table below is the decision core of this guide: read it by starting from the accuracy your use case needs (from the tier table earlier), then check whether the tag cost and infrastructure fit your store economics.
| Technology | Typical accuracy | Tag cost | Infra cost | Battery | Best retail fit |
|---|---|---|---|---|---|
| Bluetooth AoA | 10–50 cm | Low ($) | Medium (smart anchors) | Years | Fixture-level analytics, pick-up rate, tag binding at scale |
| UWB | 10–30 cm | Medium ($$) | High | Months–year | Highest-precision assets, robotics, premium zones |
| Passive RFID | Zone / presence | Cents | Low–medium | None (passive) | Full-store apparel inventory & stock accuracy |
| BLE beacons (RSSI) | 1–5 m | Low ($) | Low | Years | Proximity offers, aisle-level context |
| Wi-Fi (RSSI / RTT) | 5–15 m / 1–2 m | None (phone) | Reuse APs | Phone | Footfall heatmaps, coarse wayfinding |
| Geomagnetic / visual | 1–3 m | None (phone) | Low (mapping) | Phone | App-based shopper navigation |
Sources: Bluetooth SIG (AoA); IEEE 802.15.4z & FiRa Consortium (UWB); MDPI BLE RSSI study; Auburn RFID Lab & Avery Dennison (RFID). Costs are relative orders of magnitude, not quotes.
Bluetooth AoA vs UWB: The Two High-Precision Routes
When a retail use case genuinely needs centimetre location - separating adjacent racks, binding labels to products, or counting pick-ups - the shortlist narrows to two: Bluetooth AoA and UWB. They reach similar accuracy by very different physics, and the cost structure is where they part ways.
How do their accuracy and robustness compare?
UWB is marginally more accurate and more robust to reflections; AoA is close behind and far cheaper to scale. UWB's time-of-flight measurement is inherently resistant to multipath, which is why it holds sub-0.2 m even in cluttered, non-line-of-sight conditions. AoA's angle measurement is slightly more sensitive to metal shelving and reflections, but with sufficient anchor density and calibration it delivers the same practical 10-30 cm that most retail jobs need.
Where does the cost really sit?
The decisive difference is the tag. AoA puts the complexity in the ceiling anchor and keeps the tag a simple, cheap, multi-year BLE device - so the marginal cost of tagging one more item or fixture is very low. UWB needs a more capable, more power-hungry tag, which is fine for a few hundred high-value assets but becomes the dominant cost when you want to tag thousands of garments or every fixture. For dense, item-adjacent retail analytics, that tag economics usually decides it.
| Dimension | Bluetooth AoA | UWB |
|---|---|---|
| Typical accuracy | 10–50 cm | 10–30 cm |
| Multipath robustness | Good with calibration | Excellent (time of flight) |
| Tag cost & power | Low, multi-year battery | Higher, shorter battery |
| Scalability (many tags) | Strong - tag is cheap | Limited by tag cost/power |
| Ecosystem | Standard BLE 5.1 Direction Finding | IEEE 802.15.4z, FiRa; in flagship phones |
| Best retail fit | Dense fixture/item analytics, pick-up rate, label binding | Fewer high-value assets, robotics, premium accuracy zones |
Sources: Bluetooth SIG; IEEE 802.15.4z / FiRa Consortium. Figures are typical deployment ranges.
Rule of thumb: choose UWB when you have a limited number of high-value things that demand the utmost precision and multipath resilience; choose Bluetooth AoA when you need centimetre-class location across many tags at low cost per tag and long battery life - which is exactly the profile of apparel fixtures, garments and shelf labels.
Power Consumption: Which Route Drains Batteries?
How do the technology routes compare on power?
Battery life is usually decided by duty cycle, not by the headline radio standard. A passive RFID label has no battery at all, a BLE or Bluetooth AoA tag can sleep most of the time and wake for short radio bursts, and a UWB tag spends more energy during each ranging exchange. For a retailer, that means "high accuracy" and "low maintenance" can coexist only when the system moves work into powered infrastructure and keeps active tags quiet until an event matters.
| Technology route | Where power is consumed | Relative tag draw | Battery implication | Retail design note |
|---|---|---|---|---|
| Passive UHF RFID | Reader energizes the label during a scan | None on the tag | No tag battery maintenance | Best default for item-level apparel inventory and cycle counts. |
| BLE beacons (RSSI) | Tag or phone sends/receives periodic advertisements | Low when interval is long | Months to years depending on beacon rate and battery size | Good for coarse zones; do not increase advertising rate just to chase precision. |
| Bluetooth AoA | Tag emits BLE direction-finding packets; ceiling anchors do the heavy work | Low to medium | Often multi-year for fixture tags when event-driven | Strong power/accuracy balance because costly computation lives in PoE anchors. |
| UWB | Tag and anchors exchange precise ranging packets | Medium to high during ranging | Shorter life unless update rate is tightly controlled | Reserve for high-value assets, robotics, safety zones or short-duration workflows. |
| Wi-Fi RTT / RSSI | Phone and access points perform scans or round-trip timing | No item tag battery, but phone battery matters | Depends on app behaviour and scan frequency | Use for app-based wayfinding, not low-cost item tagging. |
| Visual / VPS | Phone camera, edge cameras or local compute process images | No radio tag battery | Power shifts to phone, camera and compute infrastructure | Useful for navigation and context, but privacy and compute cost become the constraint. |
Sources: Nordic Semiconductor nRF52840 Product Specification for BLE radio current profiles; Qorvo DW3000 datasheet for UWB current profiles; GS1 RFID standards; Android Wi-Fi RTT documentation. Always calculate battery life from the chosen silicon, firmware interval, battery chemistry and store temperature.
How should a retailer solve the battery problem?
The practical answer is to tier the estate by event value: passive where identity is enough, BLE/AoA where real-time location earns money, and UWB only where its precision changes the outcome. The power budget should be designed before procurement, not after the first battery replacement cycle surprises operations. The same principle applies to ESL battery life: average current over a year matters more than peak current during one refresh or one ranging burst.
| Battery tactic | What it means in practice | Why it works |
|---|---|---|
| Make passive RFID the inventory backbone | Use cents-level passive tags for every item that only needs identity, count or zone confirmation. | It removes battery maintenance from the highest-volume layer. |
| Move intelligence into powered anchors | Prefer PoE ceiling anchors, gateways and edge processors for compute-heavy angle/location work. | The tag can stay simple and sleep longer. |
| Use event-driven reporting | Transmit on motion, pick-up, zone change or staff request instead of broadcasting every second. | Most products are stationary most of the day. |
| Set different update rates by asset class | High-value trolleys or robotics update often; ordinary garments update only on interaction. | Power follows business value instead of a single blanket rule. |
| Monitor battery state as an operations KPI | Track tag voltage, last-seen time and predicted replacement windows in the same platform that manages ESLs. | Battery replacement becomes planned maintenance, not shelf-floor firefighting. |
| Test in the real store environment | Run pilots under metal shelving, dense crowds, cold zones and real opening hours. | RF reflections, temperature and motion patterns change both accuracy and battery drain. |
Apparel Deep-Dive: Pick-Up Rate and Inventory Accuracy
Apparel is where positioning and item-level tagging deliver the clearest returns, because two things dominate clothing economics: whether the right stock is actually on the floor, and whether shoppers engage with a style before it sells. Location technology addresses both.
How is "pick-up rate" measured with location technology?
Pick-up rate is the physical-store equivalent of an online product's click-through: the share of passers-by who physically lift an item off the rail. With tagged garments or instrumented fixtures, the system detects a lift (a tag leaving its rest position and moving), a carry, a fitting-room entry, and a put-back. Aggregated, these events answer merchandising questions receipts never could: which styles attract hands but do not convert, which displays drive interaction, which sizes get tried and abandoned.
Industry practice already shows the value. RFID-enabled smart fitting rooms capture "tried but not purchased" data, recommended pairings and size demand, feeding merchandising and forecasting. High-precision AoA extends the same idea to the open floor: instead of only knowing what entered a fitting room, you see the full interaction funnel from rack to till. That funnel is the missing analytics layer between footfall counters at the door and the point of sale.
How does location improve inventory accuracy?
Item-level RFID is the proven route to high inventory accuracy, and it is the single most-cited apparel ROI in the industry. The Auburn University RFID Lab's multi-year apparel benchmarks show retailers moving from a ~63% SKU-level accuracy baseline to 95%+ after item-level RFID, cutting out-of-stocks by up to 50% and reducing physical inventory work from about eight days a year to half a day. The lab's Project Zipper work with GS1 US further found RFID users reaching 99.9% order accuracy across the supply chain.
Accurate stock is not a back-office nicety - it is front-line revenue. A style shown as out of stock but actually mislaid is a lost sale and often a needless markdown at season end. Getting accuracy from two-thirds to near-complete is what makes omnichannel promises like "buy online, pick up in store" and "ship from store" actually reliable.
The practical apparel pattern that has emerged: use RFID as the identification and inventory backbone, and add a high-precision AoA layer where real-time location and interaction analytics justify it - flagship stores, high-margin categories, or zones where merchandising insight moves the numbers. The two are complementary, not competing.
A Transparent ROI Model for an Apparel Store
The numbers below are an illustrative model, not a quote. They exist to show the shape of the return and which levers matter, so an integrator can drop in a client's real figures. Every assumption is stated; change one and the outputs move.
ROI layer 1 - inventory accuracy (RFID)
| Line item | Basis | Annual value |
|---|---|---|
| Recovered sales from fewer stockouts | OOS cut ~50%; recover ~1.5% of revenue | +$18,000 |
| Shrink reduction | ~25% of $18,000 shrink | +$4,500 |
| Labour saved on counts | 8 days → 0.5 day + auto cycle counts | +$3,000 |
| Fewer end-of-season markdowns | Better accuracy & placement | +$3,000 |
| Tags | 24,000 × $0.08 | −$1,920 |
| Readers / handhelds / fixed infra | ~$12,000 capex ÷ 3 yr | −$4,000 |
| Net annual benefit | ≈ +$22,600 |
Uplift ranges based on Auburn RFID Lab / Avery Dennison apparel benchmarks; monetary values illustrative.
ROI layer 2 - pick-up-rate analytics (Bluetooth AoA)
| Line item | Basis | Annual value |
|---|---|---|
| Conversion uplift from merchandising insight | +1.0% of revenue on acted-on ranges | +$12,000 |
| Fewer markdowns on slow movers | Reallocate space to high-interaction styles | +$3,000 |
| Staff & asset efficiency | Faster find / replenish / wayfinding | +$2,000 |
| Anchors + fixture tags | ~10 anchors + ~300 tags, ~$4,200 ÷ 3 yr | −$1,400 |
| Location software / engine | Annual | −$1,200 |
| Net annual benefit | ≈ +$14,400 |
What is the payback?
In this model the combined hardware capex (~$16,000) is recovered in roughly 5-6 months, and the two layers together add about $37,000 of net annual benefit - a little over 3% of store revenue. The inventory layer is the surer, better-documented return; the analytics layer is higher-variance but higher-ceiling, because a single merchandising insight applied across a chain scales far beyond one store. For a multi-store rollout, run the model per store and stage the analytics layer where margins justify it.
How to Deploy an Indoor Positioning System
What does a real deployment involve?
A positioning rollout is 20% radios and 80% site engineering, integration and calibration. The hardware is the easy part; making it reliable across a live store for years is the work. A typical high-precision (AoA) deployment has five stages:
1. Site survey and anchor planning. Map the floor, identify metal and reflective surfaces, and plan anchor placement. For centimetre-class AoA, plan ceiling anchors roughly every 8-15 m depending on ceiling height and accuracy target, ensuring each location is covered by enough anchors to triangulate. 2. Cabling and power. Anchors are usually PoE, so factor switch capacity and cable runs. 3. Tagging. Fit tags to garments, fixtures, trolleys or badges; for apparel, decide what is item-level RFID versus what carries an active AoA tag. 4. Calibration. Register anchors to the store map and calibrate antenna arrays - this step largely determines real-world accuracy. 5. Integration. Stream location data into the systems that use it.
How does positioning connect to ESL, POS and ERP?
Location is only valuable once it joins your other retail data. The location engine should expose a clean API or message stream (HTTP/REST, UDP, MQTT or WebSocket are common) so a business platform can subscribe to positions and events. In practice that means binding a tag to a SKU and a shelf label, reconciling RFID inventory against the ERP system of record, and correlating pick-up events with point-of-sale conversion. A store that already runs electronic price tags and an AI ESL platform has most of the data plumbing; positioning adds the spatial dimension on top. Warehouse and back-of-house operations follow the same pattern - see warehouse ESL solutions and the guide to warehouse shelf labels.
What drives the cost?
Four levers dominate the bill: accuracy tier (centimetre needs denser anchors), tag count and type (cents for passive RFID, dollars for active tags), infrastructure (anchors, PoE, servers) and integration and services (calibration, software, support). The mistake that wrecks budgets is buying more accuracy than the use case needs across the whole store, instead of layering high precision only where it earns its keep.
How to Choose a Positioning Technology
A practical selection checklist
Work from the job backwards to the technology, never the reverse. Answer these in order and the shortlist falls out:
| Question | If the answer is... | Lean toward |
|---|---|---|
| Do you need coordinates, or just presence? | Presence / counts | Passive RFID |
| What is your accuracy floor? | Centimetre (fixture/item) | Bluetooth AoA / UWB |
| 1-5 m (aisle/zone) | BLE beacons | |
| Room-level only | Wi-Fi (reuse APs) | |
| How many things must you tag? | Thousands, low cost each | AoA (cheap tags) |
| Few, highest precision | UWB | |
| Is battery life critical? | Years per tag | AoA / BLE |
| Reuse existing infrastructure? | Yes, Wi-Fi already there | Wi-Fi RTT/RSSI |
For most apparel and general-merchandise retailers the answer is not one technology but a layered stack: passive RFID for inventory, a high-precision AoA layer for real-time location and interaction analytics, and cheap BLE or Wi-Fi for coarse footfall - each applied only where its accuracy is required.
Where High-Precision AoA Fits Best
Bluetooth AoA occupies a genuinely useful sweet spot: centimetre-class accuracy at a tag cost and battery life that let you scale to thousands of items and fixtures. That combination is exactly what the two highest-value retail jobs demand - real-time inventory location beyond a doorway scan, and fixture-level pick-up analytics that separate one rail from the next. Where a store needs precise location across many low-cost, long-lived tags, AoA is usually the most economical path to the accuracy tier that makes those analytics possible.
That is not a universal verdict, and honesty about the boundaries matters. UWB remains the choice when a smaller number of assets demand the absolute best precision and multipath resilience, or where phone-native UWB is part of the experience. Passive RFID remains unbeatable for cents-per-tag full-store inventory and is the backbone most apparel retailers should start from. BLE and Wi-Fi remain the right, cheap answer for coarse footfall and proximity. The strongest deployments are layered, and AoA is the layer that has, until recently, been missing between zone-level RFID and metre-level beacons.
For an integrator, the takeaway is simple: match the technology to the accuracy the outcome truly needs, prove the inventory case first because it is the surest return, then add a high-precision AoA layer where interaction analytics and real-time location move the numbers.
An Open Ending: What Happens When the Store Becomes Spatially Aware?
The next frontier is not a single winning radio; it is a store data layer where every shelf label, RFID read, AoA coordinate, UWB event and POS transaction can be understood together. Once the floor has a live coordinate system, retail software stops asking only "what sold?" and starts asking richer questions: where was the product before it sold, how many shoppers touched it, which display moved it, and what should the store change next?
That future will need more than accurate dots on a map. It will need open event streams, privacy boundaries, clean product-to-location binding and AI agents that can reason across inventory, shelf labels, planograms and store tasks. A positioning system that cannot export its events becomes another closed dashboard. A positioning system that feeds an AI ESL platform becomes part of the store's memory.
So the better closing question for retailers is intentionally open: which locations in your store are still invisible, and what decision would change if they became measurable? Start there, then let the accuracy tier, battery design and integration architecture follow.
Sources
- Bluetooth SIG - AoA Direction Finding and high-precision location
- IEEE - Performance of UWB IEEE 802.15.4z ranging and positioning
- FiRa Consortium - What UWB does (precise, secure ranging)
- MDPI Sensors - A Practice of BLE RSSI Measurement for Indoor Positioning
- Auburn University RFID Lab - apparel inventory accuracy benchmarks
- Avery Dennison - The true value of inventory accuracy for retailers
- Verified Market Research - Indoor Positioning and RTLS Market
- Nordic Semiconductor - nRF52840 Product Specification
- Qorvo - DW3000 UWB transceiver datasheet
- GS1 - RFID standards and item identification
- Android Developers - Wi-Fi RTT