This article separates the three because they are usually sold as one. A supplier deck will show accuracy, efficiency and merchandising as a single row of icons, implying the same weight of proof behind each. There is not. Below, each claim is graded by the evidence that actually exists, and the numbers come from the US Federal Trade Commission, the National Institute of Standards and Technology (NIST) and the National Conference on Weights and Measures (NCWM) — not from ESL vendors.
A note on terminology before we start: everything in this article concerns labels that mirror an authoritative price source — Level 1 on the scale in what an AI ESL is. No model is required for any of it.
| Claim | Evidence available | What you can defend |
|---|---|---|
| Pricing accuracy | Strong on the problem, absent on the fix. Three decades of government inspection data quantify how often shelf prices are wrong. No official study has compared ESL stores with paper-label stores. | That the failure mode exists, how common it is in your store type, and that ESL structurally removes one documented cause of it |
| Worker efficiency | Modellable, not measured. The arithmetic is simple and reproducible; there is no equivalent public dataset. | A transparent model with your own inputs — not a borrowed percentage |
| Shelf merchandising | Weak. The peer-reviewed work on planogram compliance is about computer vision, not labels. | Very little. Treat any specific number here with suspicion, including ours |
How often are shelf prices actually wrong?
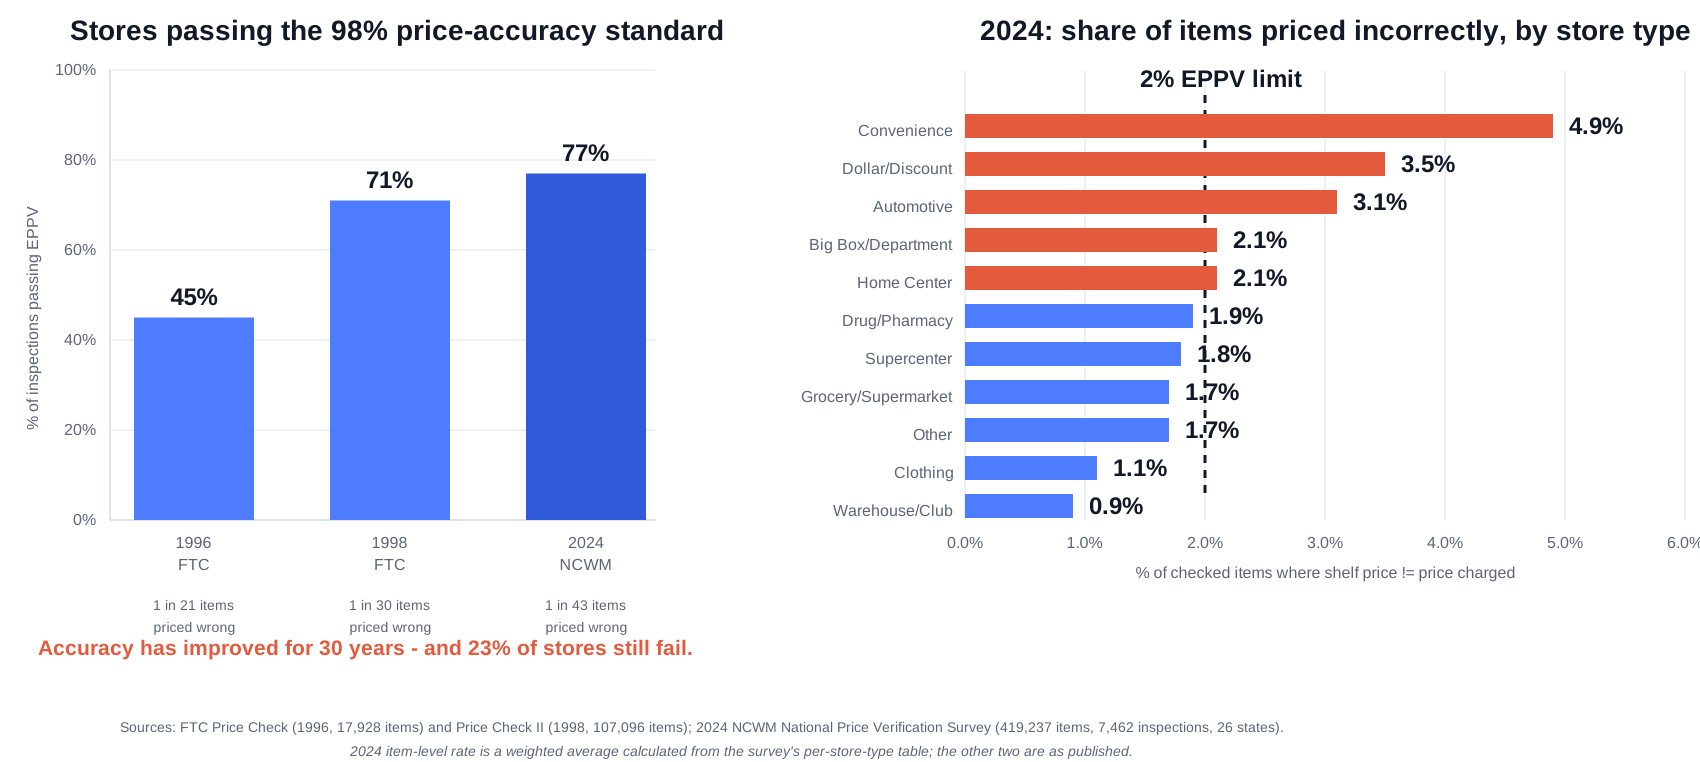
In the 2024 national survey, 23% of inspected stores failed the pricing-accuracy standard, and about one item in 43 was charged at a price different from the one displayed. That is not a vendor estimate. It comes from 7,462 inspections at 7,367 stores across 26 states, in which weights-and-measures officials checked 419,237 individual items by comparing the advertised or displayed price against the price charged at the register.
The standard being applied is the Examination Procedure for Price Verification (EPPV), published in NIST Handbook 130. Its rule is blunt: a store fails when more than 2% of verified prices differ from the price charged. Pass means at least 98% matched at the moment of inspection.
Has it been getting better?
Yes, substantially — and it is still not fixed. The FTC ran two national studies in the 1990s using the same procedure, which makes a long-run comparison possible:
| Study | Scale | Inspections passing | Items priced wrong |
|---|---|---|---|
| FTC “Price Check” (1996) | 17,928 items, 7 jurisdictions | 45% | 1 in 21 |
| FTC “Price Check II” (1998) | 107,096 items, 37 jurisdictions | 71% | 1 in 30 |
| NCWM National Survey (2024) | 419,237 items, 26 states | 77% | 1 in 43* |
Sources: FTC Price Check (1996) and Price Check II (1998); 2024 NCWM National Price Verification Survey, conducted with NIST. *The 2024 item-level figure is a weighted average we calculated from the survey’s per-store-type table (the item counts reconcile exactly to the published 419,237); the 1996 and 1998 figures are as published. None of the three studies compared electronic labels against paper labels.
Which store types have the worst pricing accuracy?
Convenience stores, at 4.9% of items priced incorrectly — nearly two and a half times the EPPV limit. Five of the eleven categories exceeded the 2% threshold on average. Grocery and supermarket, the format most associated with ESL adoption, sat at 1.7%, with 83% of stores passing. The gap is worth noting for anyone weighing a rollout: the format with the worst measured accuracy is also the one with the smallest labour base to absorb manual re-pricing, which is part of why convenience formats tend to be evaluated differently.
| Store type | Items priced incorrectly | Inspections passing |
|---|---|---|
| Convenience | 4.9% | 66% |
| Dollar / Discount | 3.5% | 71% |
| Automotive | 3.1% | 73% |
| Big Box / Department | 2.1% | 74% |
| Home Center | 2.1% | 76% |
| Drug / Pharmacy | 1.9% | 79% |
| Supercenter | 1.8% | 76% |
| Grocery / Supermarket | 1.7% | 83% |
| Clothing | 1.1% | 88% |
| Warehouse / Club | 0.9% | 88% |
Source: 2024 NCWM National Price Verification Survey, Table 2. The “Other” category (1.7%, 85% passing) is omitted here. Note that even in the best-performing categories, more than one store in ten failed.
Does passing an inspection mean a store’s pricing is clean?
No, and this is the most useful detail in the 2024 data. Of the 5,751 stores that passed, 1,508 still had pricing errors — they simply had few enough to stay under the 2% line. Only 57% of all inspections found zero errors.
There is a sharper version of this. The EPPV notes that when overcharges outnumber undercharges by 2:1 or 3:1, that pattern may indicate a systematic problem rather than random slippage. Among large-sample inspections, 264 stores showed a 2:1 to 3:1 overcharge ratio — and 124 of them still met the 2% requirement. A store can pass the test while running a skewed, structural pricing fault. If your own internal audits use a single pass/fail threshold, you are likely missing the same thing.
What actually causes a pricing error?
The FTC asked inspectors to record causes, and the answer was mostly a synchronisation failure: shelf tags and signs that had not been updated to match the price in the store’s computer. The 1998 report describes it plainly — store employees maintain tags and signs throughout the store, and errors occur when those displays fall out of step with the system of record, or when the system itself is updated late or incorrectly.
That distinction matters more than any single statistic in this article, because it splits the problem into two halves that need completely different fixes:
- Sync failure — the system of record is right, the shelf is wrong. Someone missed a tag, printed the wrong batch, or put the right tag on the wrong facing. This is a physical-process problem.
- Source-data failure — the shelf faithfully displays a price that was wrong in the first place. A bad promotion end-date, a mis-keyed margin, a feed that failed halfway through.
Are promotions worse than everyday prices?
Yes, on both counts. The 1998 study separated sale from non-sale items and found errors in one of every 28 sale items versus one in 32 non-sale items. The more telling split is direction: for sale items, almost two-thirds of errors were overcharges, while for non-sale items only about one-third were.
In other words, the shopper is most likely to be overcharged precisely on the item that was advertised as a discount. Inspectors attributed sale-item errors to a longer list of causes — shelf tags, item prices, sign prices, out-of-date signage and the computer price all had to agree, and any one of them could break the chain.
This connects directly to the economics. The single biggest driver of ESL payback is how often each label’s price changes, as we set out in how to calculate ESL ROI. The same variable that determines your payback period also determines your exposure to pricing errors. A promotion-heavy operation is the one that benefits most on both lines — which is a genuine argument, and a rare case where two independent benefits point the same way.
Do electronic shelf labels actually fix this?
They structurally eliminate the first failure mode and do nothing about the second. This is the honest answer, and it is more useful than a percentage.
When labels are driven from a single price source, the sync failure the FTC documented largely stops being possible. There is no batch to print, no aisle to walk, no tag to miss on a busy Friday, and no window in which the shelf and the register disagree because a human has not caught up yet. The class of error is removed by design rather than by diligence.
The second failure mode is untouched — and arguably gets worse. If the price in your system of record is wrong, electronic labels propagate that error to every facing in every store, instantly and consistently. Paper is slow enough that someone sometimes notices before the whole estate is wrong. Electronic labels make your price master the single point of failure. That is a good trade, but only if you treat the integration and the data governance behind it as seriously as the hardware, which is why we wrote a separate guide on connecting ESL to POS, ERP and legacy databases.
What does a pricing error cost?
More than the price difference, and in both directions. The 1998 study captured something most business cases miss: undercharges cost the retailer more per event than overcharges cost the shopper.
| Cost | Who pays | What the data shows |
|---|---|---|
| Overcharge | Shopper | Averaged $3.20 per event in the 1998 study. Triggers refunds, goodwill gestures and complaints. |
| Undercharge | Retailer | Averaged $5.28 per event — 65% more than the average overcharge. Pure margin leakage, and nobody complains about it. |
| Regulatory | Retailer | Misrepresenting a displayed price is unlawful in all 50 states. Enforcement sits with state weights-and-measures authorities; the FTC has jurisdiction over advertising and pricing practices. Exposure is highest in regulated categories such as pharmacy. |
| Trust | Retailer | Not quantified in any of these studies. A shopper who catches a mismatch once starts checking every price. |
Sources: FTC Price Check II (1998) for the per-event averages; NIST Office of Weights and Measures for the regulatory position. Dollar figures are from 1998 and are not inflation-adjusted — treat them as showing the relationship between the two error types, not current values.
The undercharge finding deserves a moment. Every ESL business case we have seen frames pricing accuracy as a customer-experience or compliance benefit. The 1998 data suggests the larger direct financial exposure ran the other way: the retailer quietly selling below its own intended price, on items nobody flags. If you want to size this for your own estate, the honest method is to audit a sample of your own facings rather than apply anyone’s national average. Our paper-versus-electronic cost comparison treats this as a standing cost line rather than a one-off.
Worker efficiency: what the numbers support
This leg is arithmetic, not measurement. There is no government dataset on re-pricing labour equivalent to the price-verification surveys, so anyone quoting a labour-saving percentage is either modelling it or repeating a vendor figure.
Modelling it is legitimate as long as the assumptions are visible. The version we publish assumes 90 seconds for a complete manual re-tag — generating and printing the batch, walking the aisle, locating the facing, swapping the tag and correcting mistakes found later — and an 85% labour reduction rather than total elimination, because shelf audits, damaged units and non-ESL promotional signage do not go away. You can change both in our ESL ROI calculator and watch the payback move.
We are deliberately not repeating that analysis here. The full derivation, including why store size largely cancels out of the payback formula and how statutory wage rates shift the answer across thirteen jurisdictions, is in the ROI guide.
One point does belong in this article. Labour saving and pricing accuracy are not independent benefits — they are the same mechanism counted twice. The reason manual re-pricing costs 90 seconds is the same reason it sometimes gets missed. If you claim both the full labour saving and a large accuracy benefit, check that you are not double-counting one improvement in two rows of the same spreadsheet.
Shelf merchandising: the weakest of the three claims
We could not find credible independent evidence that electronic shelf labels improve merchandising or planogram compliance. That is a finding, not an omission.
What does exist is evidence for a different technology solving that problem. A 2025 study in Scientific Reports describes an automated shelf-monitoring system deployed across more than 7,000 7-Eleven stores in Taiwan, using computer vision and deep learning to detect shelves, recognise products and compare actual layouts against digital planograms — with reported savings in manual inspection time. That is a real, peer-reviewed result, and it is about cameras and models, not about labels.
The claims we found attributing merchandising gains to ESL itself traced back to vendor blogs and supplier marketing, including a widely repeated shopper-perception statistic whose underlying methodology we could not verify. We have left it out.
The defensible version of this claim is narrow: a label fixed to the shelf edge and addressable from a central system makes it easier to locate a facing and to flag a mismatch, and some deployments use label indicators for picking and audit tasks. Whether that produces measurable planogram compliance is, on the public record, unproven. If shelf compliance is your actual objective, the technology with evidence behind it is vision-based monitoring — which is why we treat shelf monitoring as a separate platform capability rather than a side effect of buying labels.
How to build the accuracy case for your own board
The national data tells you the problem is real and roughly how big it is in your format. It cannot tell you what it is worth in your stores. Four steps that survive scrutiny:
- Measure your own baseline using the official method. The EPPV is published in NIST Handbook 130 and is free. Run it as an internal audit: sample items across the store, compare displayed price to the price charged, and calculate your error rate. You will get a defensible number for your own estate instead of a national average that may not apply.
- Split your errors into sync failures and source-data failures. Only the first is addressed by electronic labels. If most of your errors trace back to bad promotion data or a broken feed, ESL is not the fix and the business case should say so.
- Count undercharges as well as overcharges. They are failures under the standard and they cost you directly. Most internal audits chase only the customer-facing half.
- Look at the overcharge-to-undercharge ratio, not just the pass rate. A skew toward overcharges points at a systematic process fault — and as the 2024 data shows, it can hide inside a technically passing store.
Then hold the accuracy benefit separate from the labour benefit in your model. If the case only works when both are counted at full value, it is fragile. Our own position, stated in the ROI guide, is that a business case should clear its hurdle on labour alone, with conservative inputs, and treat accuracy as the margin of safety. This article does not change that. It just means the margin of safety is better documented than most people realise — by the government, not by us.
The short version
Electronic shelf labels address a documented, measured, thirty-year-old problem: displayed prices that do not match what the register charges, in 23% of stores badly enough to fail a federal-standard inspection. They remove one specific and well-documented cause of that problem by design. They do not remove the other cause, and they make good master data more important, not less.
On worker efficiency, model it yourself with visible assumptions and do not double-count it against accuracy. On merchandising, be sceptical of everyone, including us — and if that is the actual goal, look at vision systems rather than labels.
If your operation is promotion-heavy, in a high-wage market, and in one of the store formats where the national data shows accuracy problems clustering, the case is strong on two independent lines. If it is none of those, be honest that the case rests mostly on labour — and go run the numbers in the calculator before anyone builds a slide.
Sources
- 2024 NCWM National Price Verification Survey Report — National Conference on Weights and Measures, with NIST Office of Weights and Measures. 7,462 inspections, 419,237 items, 26 states.
- 2024 National Price Verification Survey — NIST Office of Weights and Measures. The EPPV inspection process and regulatory position on displayed prices.
- NIST Handbook 130 — contains the Examination Procedure for Price Verification (EPPV) in full.
- Price Check II: A Follow-up Report on the Accuracy of Checkout Scanner Prices — US Federal Trade Commission, 1998. 107,096 items, 37 jurisdictions; sale vs non-sale analysis and per-event dollar averages.
- Price Check: A Report on the Accuracy of Checkout Scanners — US Federal Trade Commission, 1996. The 1996 baseline.
- Real-time retail planogram compliance application using computer vision and virtual shelves — Scientific Reports, 2025. Deployment across 7,000+ convenience stores; cited here as evidence for vision-based compliance, not for shelf labels.