There is a second, less obvious result buried in the arithmetic: store size largely cancels out. A bigger store buys more labels, but it also saves proportionally more re-pricing labour, so the two scale together. What actually moves your payback is the per-label economics. We show why below.
Why Every ESL ROI Figure You Read Is Different
Search for “ESL payback” and you will get a different answer from every source — because each one silently assumes a different store, a different promo calendar and a different wage. Forrester’s widely referenced study of a representative retail chain put the payback at 18 months. Elsewhere in the trade press and vendor material you will see 12–18 months, 18–30 months, and worked examples landing near 1.85 years. None of these are necessarily wrong; they are answers to different questions.
| What the figure usually assumes | Effect on payback | Is it stated? |
|---|---|---|
| Price-change frequency per label | Largest single lever — doubling it roughly halves payback | Rarely |
| Local wage for re-pricing labour | Second largest — scales payback inversely | Almost never |
| Whether gateways, software and install are included | Can move the capital figure by 30–50% | Sometimes |
| Whether non-labour benefits are counted | Often the difference between 3 years and 18 months | Rarely broken out |
Source: comparison of publicly available ESL ROI material; the named 18-month figure is from the Forrester study commonly cited in industry coverage. Other ranges are cited by industry sources without a consistent stated methodology, which is precisely the problem this article addresses.
The Four Inputs That Decide Your Payback
You only need four numbers, and you already have three of them.
| # | Input | Where to get it | Typical range |
|---|---|---|---|
| 1 | All-in cost per labelled position | Vendor quote — insist it includes gateways, software and install, not just tags | $7–$15 |
| 2 | Price changes per label per year | Your pricing/promo system — count actual changes, not planned campaigns | 12–50+ |
| 3 | Minutes per manual re-tag | Time it in your own aisle: print, walk, locate, swap | 1–3 min |
| 4 | Fully-loaded hourly wage | Payroll — gross wage plus employer on-costs | See country table below |
Note what is not on the list: SKU count, store count, and floor area. They affect the size of the cheque, not the speed of the return.
The Formula, and a Worked Example
Because the capital cost and the labour saving both scale with the number of labels, the label count cancels and you are left with a compact per-label formula:
C = all-in cost per labelled position
F = price changes per label per year
m = minutes per manual re-tag
e = labour-reduction rate achieved by ESL
W = fully-loaded hourly wage
A worked example for a mid-size supermarket. Every value here is an assumption, chosen to be plausible rather than flattering — substitute your own:
| Variable | Assumed value | Why |
|---|---|---|
| C — cost per position | $9 | Mid-range of the $7–$15 all-in band |
| F — changes per label/year | 25 | Roughly one change every two weeks |
| m — minutes per re-tag | 1.5 | Print, walk, locate, swap |
| e — labour reduction | 85% | Reduction rate commonly cited by industry sources |
| W — fully-loaded wage | $17.13 | Washington State statutory minimum, 2026 |
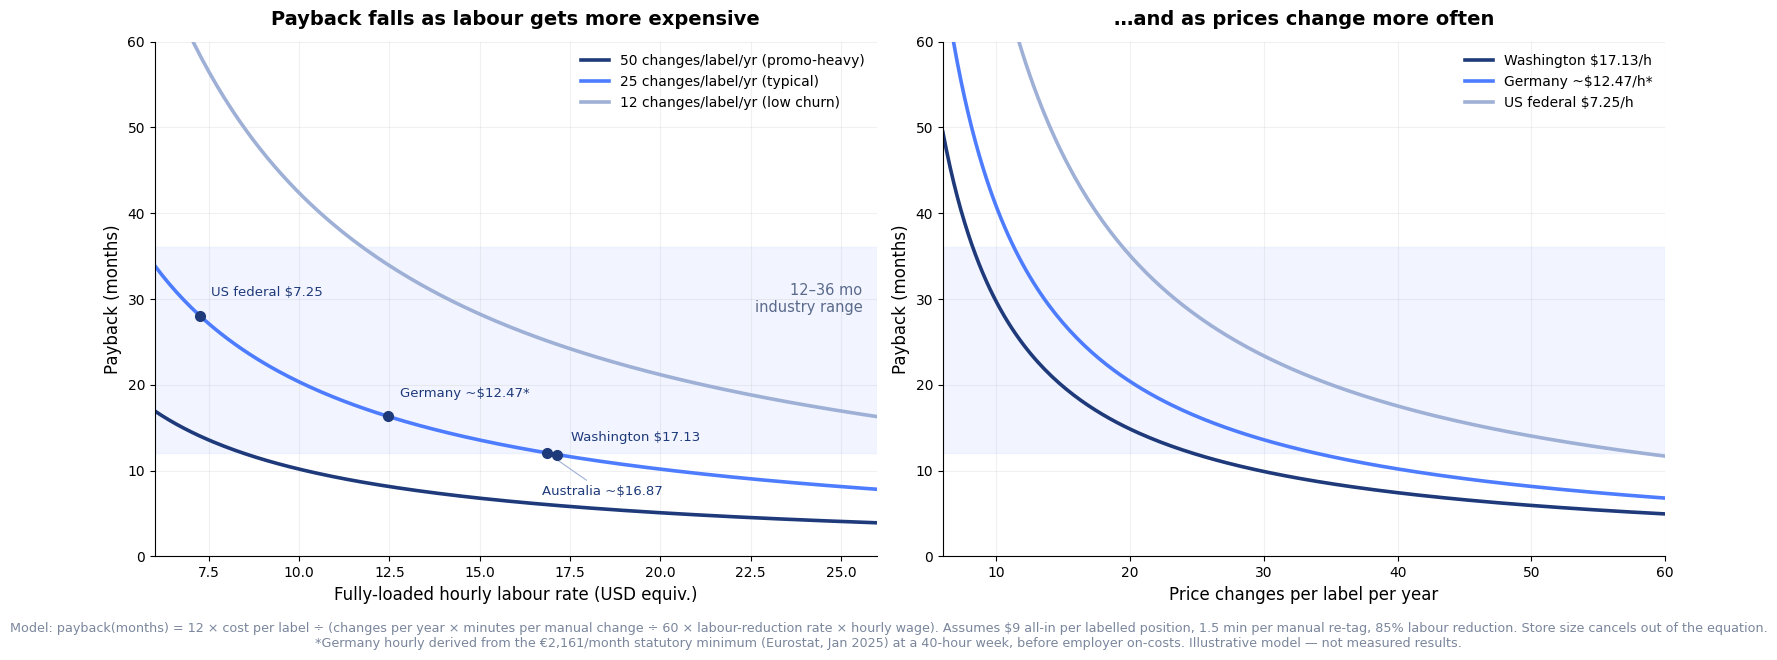
Running the numbers: 12 × 9 ÷ (25 × 0.025 × 0.85 × 17.13) = about 12 months.
Now change one variable — the wage — to the US federal floor of $7.25, and the same store, the same hardware and the same promo calendar give about 28 months. Nothing about the technology changed. Only the price of the labour it replaces.
The Labour Variable: Why the Same System Pays Back Twice as Fast in Another Country
An ESL deployment is fundamentally a trade: a one-time capital cost in exchange for removing a recurring human task. So the more expensive that human task is, the faster the trade pays off. This does not say which markets "need" automation most. It isolates the labour-substitution part of the case: holding the other inputs constant, a higher fully loaded hourly labour cost shortens the labour-only payback period.
To make that relationship reproducible, the table uses statutory adult minimum wages rather than estimated supermarket salaries. These are public wage-floor comparators, not estimates of what a retailer actually pays or of a fully loaded labour cost. For a real business case, replace them with your own payroll rate after employer contributions, benefits and local on-costs.
| Country / jurisdiction | Statutory minimum | Basis |
|---|---|---|
| Luxembourg | €2,704 / month | Eurostat, Jan 2026 (skilled rate is higher) |
| Ireland | €2,391 / month | Eurostat, Jan 2026 |
| Netherlands | €2,295 / month | Eurostat, Jan 2026 |
| Germany | €2,343 / month | Eurostat, Jan 2026 |
| Belgium | €2,112 / month | Eurostat, Jan 2026 |
| France | €1,823 / month | Eurostat, Jan 2026 (35-hour week) |
| United Kingdom | £12.71 / hour | National Living Wage, 21+, from Apr 2026 |
| Australia | A$26.44 / hour | National minimum wage, from Jul 2026 |
| New Zealand | NZ$23.95 / hour | Adult rate, 16+, from Apr 2026 |
| United States — Washington | $17.13 / hour | Highest state rate, 2026 |
| United States — New York City | $17.00 / hour | NYC, Nassau, Suffolk, Westchester, 2026 |
| United States — California | $16.90 / hour | State rate, 2026 |
| United States — federal floor | $7.25 / hour | Unchanged since July 2009; ~20 states use it |
Sources: Eurostat minimum wage statistics (January 2026) for EU figures; national minimum wage authorities for the UK, Australia and New Zealand; US Department of Labor and state rates for 2026. Two cautions when comparing: weekly working hours differ by country (France 35 hours, others up to 48), so monthly-to-hourly conversions are not directly comparable; and these are legal floors, not fully loaded labour costs.
The most striking figure is not international at all. Within the United States, the federal floor of $7.25 and Washington State’s $17.13 differ by 2.4× — enough, on the formula above, to swing an identical deployment from roughly 12 months to roughly 28. Any vendor quoting you a single global payback number is, at best, quoting you someone else’s jurisdiction.
Payback Benchmarks by Store Type
Format matters mainly because it predicts price-change frequency. Use these as starting brackets, then replace them with your own numbers from the formula:
| Store type | Typical change frequency | Indicative payback* | What drives it |
|---|---|---|---|
| Supermarket / grocery | High | Fastest in the 12–36 band | Dense promo calendar, fresh markdowns |
| Pharmacy | Medium | Middle of the band | Regulated pricing, frequent variant changes |
| Electronics / DIY | Medium–high | Middle of the band | Competitive repricing, spec-heavy labels |
| Convenience | Low–medium | Slowest in the band | Fewer SKUs, steadier prices |
| Warehouse / DC | Low price churn, high pick volume | Judge on picking accuracy, not repricing | Value is in location accuracy and pick-to-light, not price changes |
* Indicative brackets within the commonly cited 12–36 month range, assuming a mid-to-high wage market. In a low-wage market shift every row later. Validate with the formula and your own labour rate.
Five Ways Retailers Overestimate Their ROI
Every one of these makes the business case look better on paper and worse in year two.
- Counting labels but not the system. Gateways, software licences, integration and installation are real capital. Ask for an all-in per-position figure — our cost breakdown lists the four components.
- Using best-case battery life. A "10-year" label quoted with no update frequency attached is not a specification. Life falls as refresh frequency rises — and high refresh frequency is exactly the scenario that makes your ROI look good. See what actually determines battery life.
- Ignoring installation and training. Mounting rails, binding tags to products and training staff are one-time but not free, and they land in the same year as the hardware.
- Treating dynamic-pricing uplift as certain. Margin gains from AI pricing are real but they are a policy choice you have to implement, measure and defend — not an automatic property of the hardware. Model them separately, and be prepared to hit payback without them.
- Ignoring migration cost. If the platform only drives its own labels, the next upgrade is a rip-and-replace across every store. That cost belongs in the model even though it falls outside the payback window — see open vs closed ESL systems.
What ROI Looks Like Beyond Labour
Labour is the line that is easiest to defend, but it is not the whole return. Three others are real and measurable if you set up the measurement in advance:
Pricing accuracy. When the shelf and the register read from one source, shelf-versus-checkout mismatches stop happening. The saving is diffuse — refunds, disputes, staff time, and in regulated categories compliance exposure — but it is recurring. Our paper-versus-ESL comparison treats accuracy as a cost line in its own right, and we have since sized the problem against official US inspection data in what 30 years of price-verification surveys actually show.
Fresh-food markdowns. Scheduled markdowns fire on time instead of when someone gets round to the aisle, so short-dated stock sells rather than being written off. In grocery this can rival the labour line. Method and evidence in our grocery digital price tags guide — which also covers the academic study of roughly 180 million price observations finding no rise in surge pricing after ESL adoption.
Picking and replenishment. Pick-to-light and shelf-edge status cut search time for staff and online-order pickers. This is the dominant benefit in warehouse settings, where price churn is low but pick volume is high.
How to Build the Number for Your Own Estate
- Pull actual price changes per label per year from your pricing system — not planned campaigns, executed changes.
- Time a manual re-tag in your own aisle, three times, and average it.
- Get an all-in per-position quote including gateways, software and install.
- Use your fully-loaded hourly rate, not the headline wage.
- Run the formula. Then run it again with the wage from each market you operate in — the spread will surprise you.
- Only then add accuracy and markdown benefits, each with a stated measurement method.
Want this done with your numbers? Run the ROI calculator or book an assessment and we will build the model with you — including the conservative labour-only case, so you can see what the business stands on before anything optional is added. To size the capital side first, start with how much electronic shelf labels cost; for the fundamentals, see what electronic shelf labels are and our label range.
Sources
- Eurostat — Minimum wages in the EU, January 2026
- US Department of Labor — Federal minimum wage
- US Department of Labor — Consolidated state minimum wage table, 2026
- Washington State Department of Labor & Industries — 2026 minimum wage
- GOV.UK — National Minimum and Living Wage rates
- Fair Work Ombudsman (Australia) — Minimum wages
- Employment New Zealand — Minimum wage rates and types